
BCTI & PTE can help achieve your goals and solve your problems.
Let’s talk
information@brianchin.co
Administrative Offices
Waterloo, Ontario. Canada

BCTI can help you migrate from Sandvine 1.0 to Active Network Intelligence (ANI). Expertise and low cost.
Adopting Sandvine's latest Active Network Intelligence (ANI) portfolio .
We can plan your upgrade and offer a commercial incentive as part of your next ...
Policy Traffic Switch (PTS)
SDE-Subscriber Mapping
PTS, SDE - Record Generator (Rf)
PTS (Gy Integration)
PTS (Gx Integration)
PTS (Sd Integration)
SDE (Sy Integration)
SDE (Rx Integration)
SDE (Quota Manager/PCRF)
SPB (Subscriber role)
SPB (Statistics role)
Network Demographics Server (NDS)
Control Center
License Manager server
Active Logic (AL)
Maestro
Insights Data Storage (IDS)
Deep Insights / ANI portal
Active Logic Client (AL Client)
Elements
Traffic classification and Management (i.e Protocol recognition, Usage counting, Shaping, Blocking etc.) Active logic handle just Data plane traffic. All the control plane traffic and integration (ex. Gy, Gx) is moved to Maestro in Sandvine ANI architecture
Gy, PCRF (Gx), QM , Sd, Sy, Record Generator (Rf) and Rx (IMS) functionalities of PTS, SDE moved to Maestro. All Control plane functionalities to be controlled by Maestro explicitly
SPB (postgres) v/s IDS (Vertica database)
IDS provides ODBC connector for external integration
Visualization and Reporting platform
Real time traffic view and Ruleset configuration
License and ANI nodes System Configuration Manager
We are experts in Sandvine’s execution
Our objective is to understand your company
and help you meet your precise needs.

Our BCTI engineers have the hands-on product and all platform knowledge. They will help your company understand, optimize and leverage from the wide library of solutions and use cases.
Our objective is to understand your company and help you meet your precise needs. To do so, we can custom projects to fit your requirements.
Benefit from the power of machine learning and reduce the need of manual intervention
Intent-Based Congestion Management:
Manage congestion based on network QoE targets for applications.
Automated Mobile Congestion Management:
Dynamically manage mobile QoE during congestion.
Automated Home and Access Network Diagnostics:
Proactively diagnose and troubleshoot home and access issues
Automated Churn Prediction and Prevention:
Mitigate potential customer churn with proactive detection.
Stop guessing and start taking decisions with Network Intelligence!
Network Performance Monitoring and Analysis.- Monitors the metrics that makes the difference to determine if user expectations are met. Increase your customer satisfaction!
With Network Performance Monitoring and Analysis you can improve QoE, create competitive differentiation, potentially gain market share, reduce churn, and increase profitability.

Analyze and detect new trends!
Today’s Operator challenge: deliver the best possible customer experience. Personalize services and Improve customer engagement. This is accomplished understanding the user network behavior (e.g., web browsing habits, video interests, application popularity, etc.).
Poor service quality, whether real or perceived, is enough for customer to take any action, from calling support line, to consider a new network operator.
With Subscriber Service Analysis operators gain valuable customer-centric insights
that are tied to the performance of the network’s most critical and popular services. They can achieve mass personalization, unlocking monetization opportunities and improving customer retention.
Network operators have to plan and expand capacity. But the solution is more complex than simply fattening pipelines; today’s networks are a mix of traditional network elements, caches, and content delivery networks, making it difficult (and expensive) for operators to adapt existing infrastructure.
To make informed decisions about capacity planning and network engineering, today’s network operators need the deepest possible insight into usage trends.

Capacity Planning Analysis also provides more visibility into how subscribers are using the network, allowing operators to plan their network strategy for both short- and long-term needs.
Encryption is the second biggest challenge for operators when it comes to video. Thanks to encryption, operators are losing visibility on the once informative video metadata.
Video quality of experience is closely correlated to overall customer satisfaction, operators need true insight into how all types of video is performing on their network.

With VideoQoE Analysis you can get benefit from visibility into: encrypted video QoE, the root causes of poor QoE, CDN/cache efficacy, and the impact poor video QoE has on churn rates.
With this solution data operators are empowered to make quick and accurate decisions and better understand their VoIP and VoLTE delivery to subscribers.

Operators can diagnose and troubleshoot poor voice quality and identify the root cause faster and with greater context.
Nowadays it is a big challenge for operators to protect the network from malicious and organized cyber criminals.

Identifying infections earlier, operators can proactively intervene before major problems appear; for instance, by contacting users with infected devices and assisting them with a remediation process.
Sandvine has a mechanism to recognize congestion and trigger the appropriate policy that only impacts the exact part of the network or traffic. Enables network operators to balance the traffic and distribute network capacity fairly between users to ensure maximum delivered QoE. Operators can achieve balance between two competing factors – reduced CAPEX/OPEX and good QoE.

Sandvine enforces intelligent rate limits on a per-stream basis,
ensuring fairness and reducing the average bitrate per stream without compromising quality.
By managing video streaming traffic, network operators can ensure:
Consistent delivery of high-quality video
Protect other services from disruptive video traffic spikes
Extend the useful life of network infrastructure
Improve ROI and deferring investment

This typically small segment of users can account for a disproportionate amount of network bandwidth, essentially taking more than their fair share.
Network operators can ensure shared network resources remain available for all users by:
1.- measuring usage over a defined period (e.g., by day, by week, by month, by rolling window)
2.- linking management policies to different factors (e.g., time of day, risk of congestion, number of users on a resource).

By carefully managing traffic on wholesale and peering links, network operators can precisely control costs and even improve the QoE for all network users.
This use case gives operators the necessary visibility (for example, a view of where traffic is flowing and of the performance of links) to smooth traffic for better QoE and cost control.

Mitigate IPv4 address exhaustion while maintaining network visibility. An intelligence-based solution, bringing subscriber awareness for end-to-end service visibility and delivering comprehensive analytics, reporting, and user logging capabilities that can be updated with both the internal address and the external representation.

Redirects highly specific application, protocol, and subscriber traffic with great precision, ensuring only the desired flows are diverted to the network service node.
This solution allows operators to:

Increase revenue by launching innovative service plans based on perceived value and user behavior
Users only want to pay for data they actually use and want the cost-certainty associated with volume-based plans. There is no “one plan fits all” to accommodate all users, so the ability to personalize plans and offer compelling service offerings with flexibility is the winning strategy.
By deploying Usage-Based Services with Sandvine's Quota Manager, operators can add advanced options to create further differentiated service offerings, with the industry’s lowest TCO.

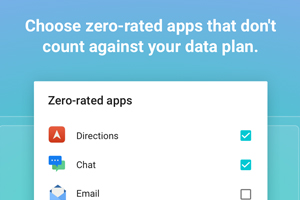
The key distinction between zero-rating and application-based plans is that application-based plans allow operators to offer specific applications versus entire service categories, which is critical when operating in highly regulated markets.
Accuracy and granularity that is unmatched due to advanced machine learning of encrypted traffic.

Is a highly personalized, differentiated network-based solution that can generate revenue and deliver “good citizen” branding for operators.

Sandvine’s leading traffic classification technology – backed by domain experts conducting active research – provides network operators with the insight needed to make informed strategic decisions relating to video and television piracy.

Sandvine’s advanced heuristics, machine learning capabilities, and vast OTT signature library can differentiate between authorized OTT VoIP apps and fraudulent or illegal OTT VoIP app calls.
Data Fraud Management
Solution leverages best- in-class traffic classification, analytics, and policy enforcement to detect and mitigate zero-rated fraud techniques to preserve legitimate revenue for network operators

Sandvine provides operators an additional set of eyes in the network to accurately measure usage and to detect problems in the control and charging planes.
The granularity of Sandvine’s network intelligence simplifies the process of reconciling revenue leakage, as it can give insights on where the OSS system is incorrectly identified – whether the issue is plan, network, or configuration-related for users whose behavior is unusual.

For this use case, ScoreCard measures all data traffic, all the time, and determines the actual performance delivered to the network’s users, regardless of access technology (e.g., DSL, Cable, Mobile, Satellite, WiFi).

Lader in network intelligence granularity and accuracy, especially for encrypted traffic. Operators also have the option to design their own custom signatures if required for custom applications. Once traffic is identified, multiple options are available to comply with data retention regulations.

Identify applications and block or rate-limit any identifiable application or service. This policy can be applied network-wide or even down to an individual subscriber service plan basis.

This solution provides the broad functionality and flexibility needed to deliver reliable compliance, while also preserving the ability to adapt to changing regulations, traffic makeup, and usage patterns.

In most (if not all) countries, network operators are required to provide specific data when presented with a warrant by law enforcement. The protection of this data – both from a privacy as well as a legal perspective – is crucial for consumers and the LEAs.
based on Sandvine’s key data capabilities, including granular and efficient data collection, which identifies and delivers only the lawfully authorized data.

Detect threats and secure national infrastructure from external and internal cyber attacks.
this solution:


BCTI & PTE can help achieve your goals and solve your problems.
Let’s talk
information@brianchin.co
Waterloo, Ontario. Canada